We have compiled a subset of data from the BMRB (Biological Magnetic Resonance Data Bank) and converted it to UCSF format for use in rNMR. The libraries posted to the right contain spectra of 270 common metabolites collected under standardized conditions. An example dataset taken from a red blood cell metabolism study is also provided along with a brief tutorial (below) showing how rNMR's ROI feature can be used to document NMR resonance assignments.
Getting Started
This page provides and example 2D HSQC dataset taken from a study of red blood cell metabolism. The data include fifteen spectra of red blood cell extracts collected from cells incubated in [U-13C]-glucose over a 12-hour time course. BMRB standards for five identifiable molecules, and an ROI assignment table, are provided. A brief, three step, tutorial describes the procedure for visualizing the five metabolites in all fifteen spectra. Download the data provided below, unzip the file in a convenient location, open rNMR, and follow the instructions below.
Step 1
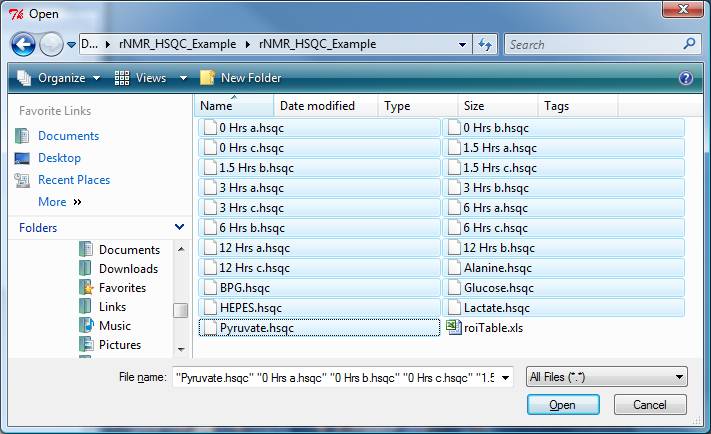
Type "fo()" in the R command console or use the rNMR menu: File --> Open spectrum. Select all of the example data ending with the ".hsqc" file extension.

Step 2
Type "import()" in the R command console or use the rNMR menu: File --> Import. Select the ROI table option in the import selection window. Select the "roiTable.xls" file provided with the example data. The ROI table will be displayed in R' s data editor after the file has been imported. Close the data editor and move on to step three.
Step 3
Open the ROI tool by typing "roi()" in the R console or by using the rNMR menu: Tools --> ROIs. Click on the "Multiple file window" under the ROI display options (see below).

